By: Dr. Reyno Scheepers and H.C. Scheepers
INTRODUCTION.
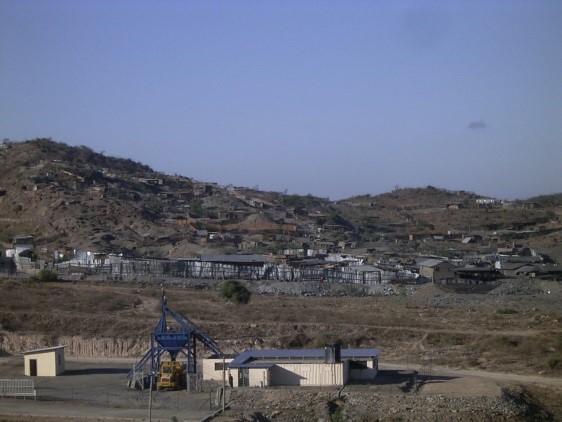
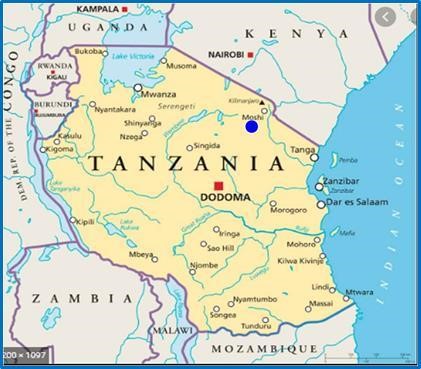
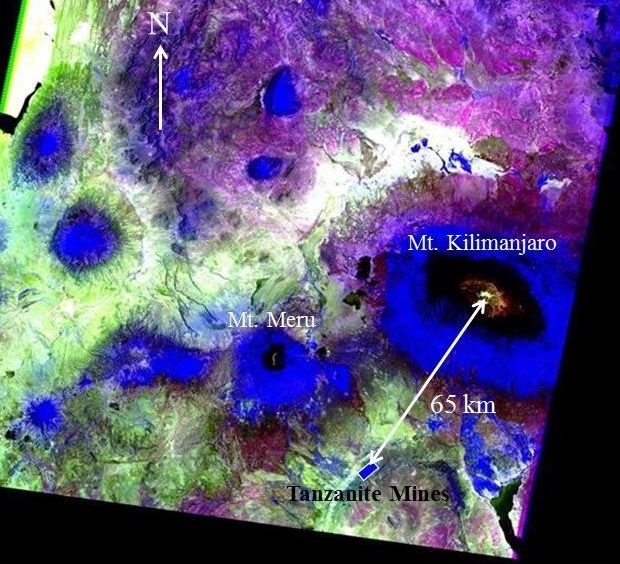
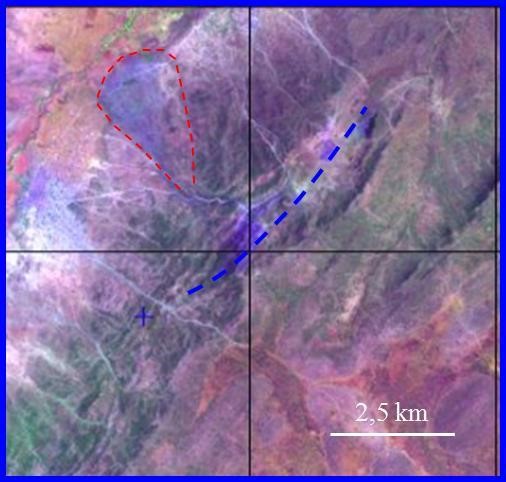
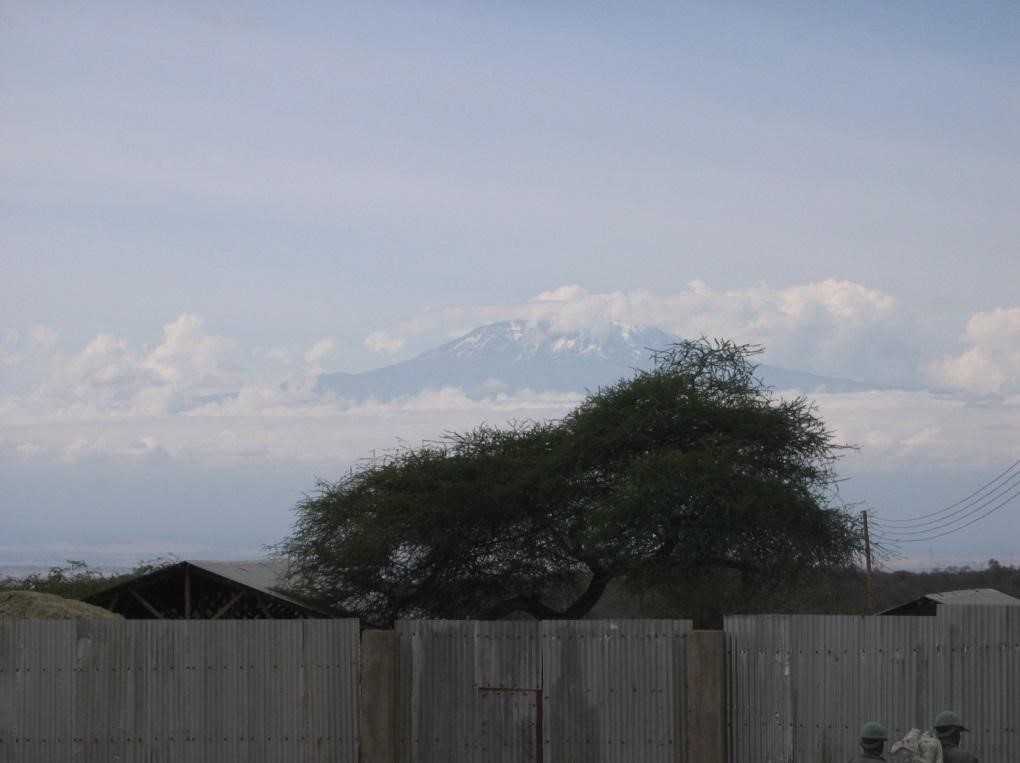
Tanzanite is found in north–eastern Tanzania approximately 65 km south-southwest of the highest free standing mountain in the world, Mount Kilimanjaro (Figs. 1, 2). Furthermore, the gemstone now known as tanzanite is named after the country that was formed on 26 April 1964 by uniting Tanganyika with Zanzibar to create the United Republic of Tanzania.
In this document we focus on the various methods of mining that are used and illustrate how the mining of tanzanite is completely controlled by the geological features of the deposit. To obtain more background on the formation of tanzanite please read “Formation of Tanzanite” also available on the Searchmin.com webite.
GEOLOGY.
The Geology, as described below, is principally focused on providing the background to the understanding of the main ore zones of the tanzanite deposit with the aim of describing how these are mined, therefore the modern understanding of the geology of the tanzanite deposit is based on the contribution of Olivier (2006), extensively referenced in this document, with some recent additions mainly from personal experience on Blocks B, C, D and D extension as well as recent literature.
1.1 Regional Geology.
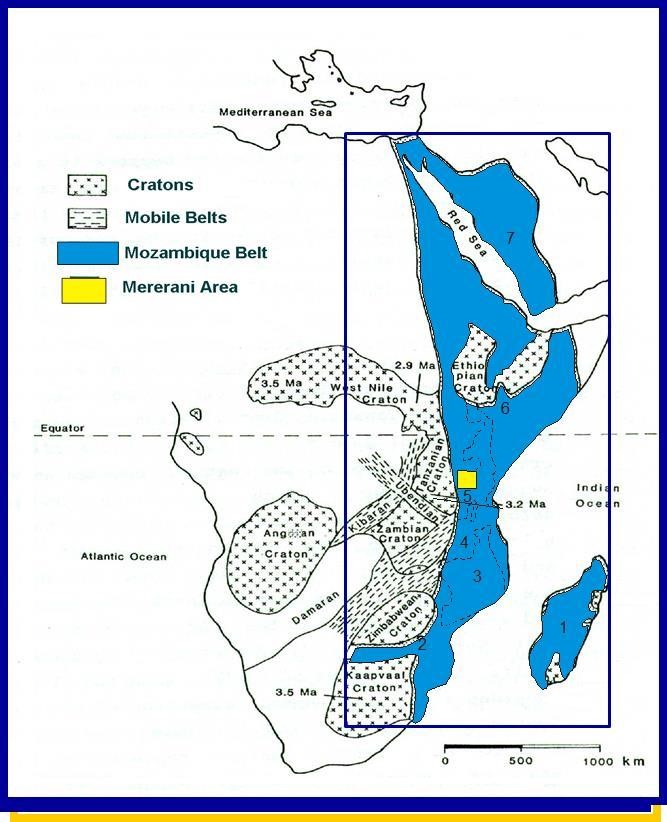
The Merelani tanzanite deposit is located within the Lelatema Mountains, in NE Tanzania, an area underlain by the Tanzanian Craton, the Mozambique Belt (Fig. 3) and Phanerozoic cover. The basement of the Mozambique Belt is predominantly Usagaran (Early Proterozoic) with a Neo-Proterozoic (Pan-African) overprint. The Lelatema Mountains form a large antiform (Fig. 4) plunging at up to 60 degrees to the Northeast (Malisa 1987). Tertiary Rift volcanic cover rocks occur to the north of the Merelani area, while the Archaean Tanzanian Craton lies to the west (Fig. 3). The Lelatema Mountains forms part of the Eastern Granulite Complex, as described by Hepworth (1972), situated in the Mozambique orogenic belt of NE Tanzania (Muhongo et al., 1994) (Fig. 3).
The Neoproterozoic East African orogeny caused extensive reworking of the rocks situated in the Mozambique belt (Stern 1994) meaning that the majority of the crustal accretion and collision tectonics in the Mozambique belt occurred at around 1 000 Ma (Pinna 1995).
However, most of the structural features in NE Tanzania were overprinted and reworked by the intense Pan African metamorphism that occurred from around 800 Ma to 450 Ma ago (Pinna 1995; Fernandez et al., 2001; Maboko 2002).
Similar to the structural features in the Usagaran complex described by Coolen et al., (1982) and Shackleton (1993, 1986), the Lelatema Mountains also contains features associated with the Pan African metamorphism, including superimposed folding, cross folding, isoclinal folds, boudinage, shear zones and sheath folds. The Lelatema Mountains consists predominantly out of various layers of graphitic gneisses and schists, calc-silicates, ultramafics and dolomitic marbles. The Merelani Tanzanite deposit is situated on the northwestern flank of the Lelatema antiform (Fig. 4).
1.2 Local Geology.
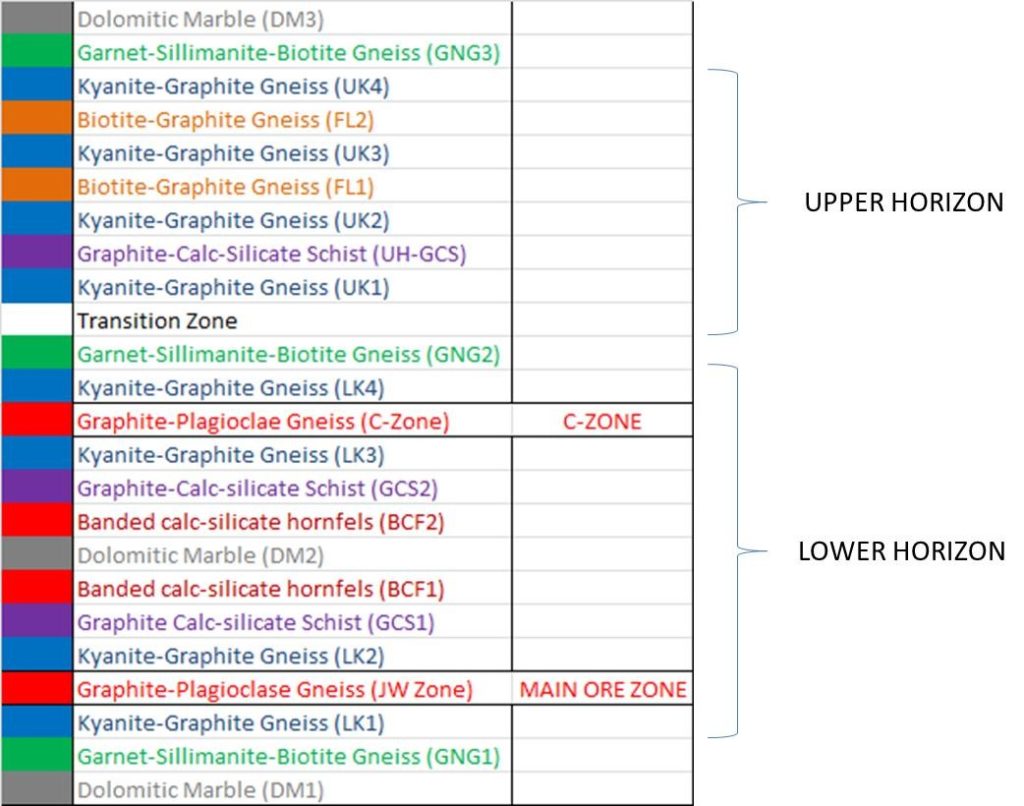
The Merelani mine succession is subdivided into two units, the Upper and the Lower Horizon, which are separated by a thick unit of garnet-sillimanite-biotite gneiss (Fig. 5) (Cilek, 1980, Davies and Chase, 1994, Martineau and Davies, 1996, Olivier 2006).
Both horizons are being mined for tanzanite, but the lower horizon is by far the major producer of the gemstone. Both horizons comprise out of a repetition of kyanite – graphite gneisses, graphite – plagioclase gneisses, graphite – calc – silicate schists, dolomitic marbles and almost pure calc – silicate units. The Upper Horizon however has a “less favorable” structure for the formation of tanzanite.
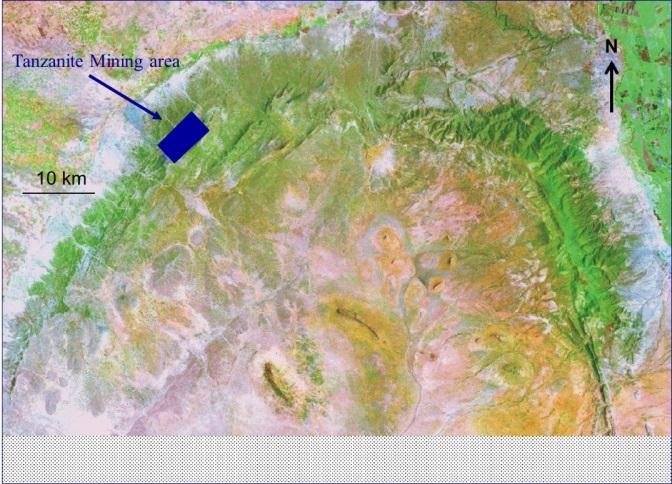
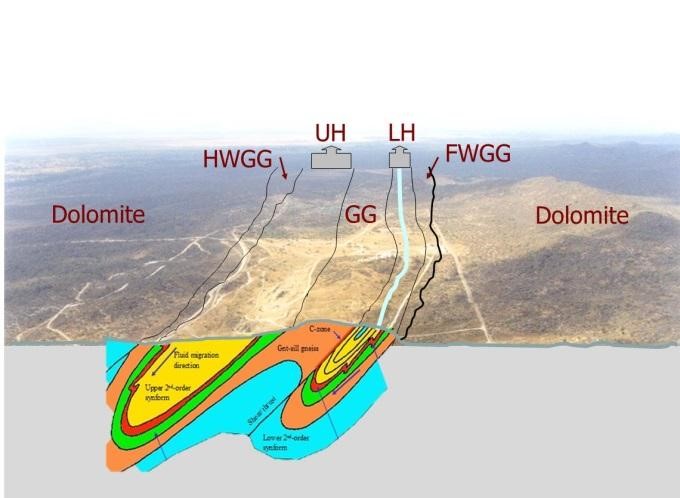
Fig. 5: Simplified diagrammatic representation of the repetition of the JW Ore zone (in red) around the central garnet gneiss unit (Modified after Olivier 2006) looking N 40°E. The Lower horizon (LH) is by far the most productive mining zone. HWGG = Hanging Wall Garnet Gneiss, UH = Upper Horizon, GG = Central Garnet Gneiss, LH = Lower Horizon, FWGG = Footwall Garnet Gneiss. Notice the dip of the JW zone to the NW (Modified after Olivier 2006).
The rocks of both horizons, including the main ore zone (the JW Zone), have a general northeasterly strike direction of between 35 and 55o and dip at between 30° and 60o to the NW. The main tanzanite producing ore zone, locally termed the JW – zone is indicated in Fig. 5. Olivier (2006) proposed a detailed stratigraphic subdivision for both the Upper and Lower Horizons, critical in the understanding of the mining of tanzanite in the Merelani area (Table 1).
A layer (up to 20 m thick), consisting of calcrete, calcareous soil, gravel and laterite overlies the metamorphic sequence.
The graphite – plagioclase gneiss units are vital to tanzanite mineralization. There are four of these namely the Ali Juuyawatu zone (the JW zone), the footwall alteration unit located within the LK1 zone, the C – zone and the D – zone. The JW zone, with an average true thickness varying between 2.0 m to 3.7 m, is of importance since it hosts the calc – silicate layer which in turn hosts the tanzanite mineralization. Lenses of kyanite – graphite gneiss occur within the JW – zone as a result of entrapment by dragging from the HW or FW during isoclinal folding or shearing or as remnants as a result of incomplete metasomatic alteration (Olivier 2006). Detailed investigation of the ore zone however reveals that it has a complex structural deformational history. The competent calc-silicate layer was intensely boudinaged and folded whilst the JW zone underwent plastic deformation.
The C – zone is of similar composition to the JW – zone and occurs between LK3 and LK4. The D – zone is situated between LK5 and LK6 (not on Table 1) and widens towards Block D where it is a source of tanzanite in a similar setting than the JW – zone in Block C.
The characteristics of the graphite plagioclase gneisses are quite distinct from the surrounding units; they are finer grained, contain diopside close to the calc-silicate contact, decreased mica content and an increase in plagioclase content as well as anorthite (Ca-rich) content of plagioclase.
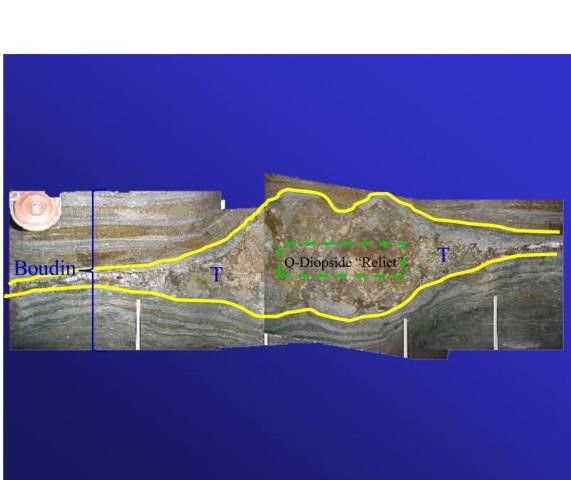
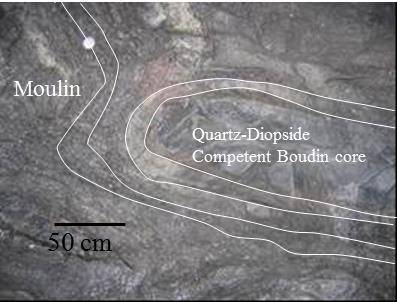
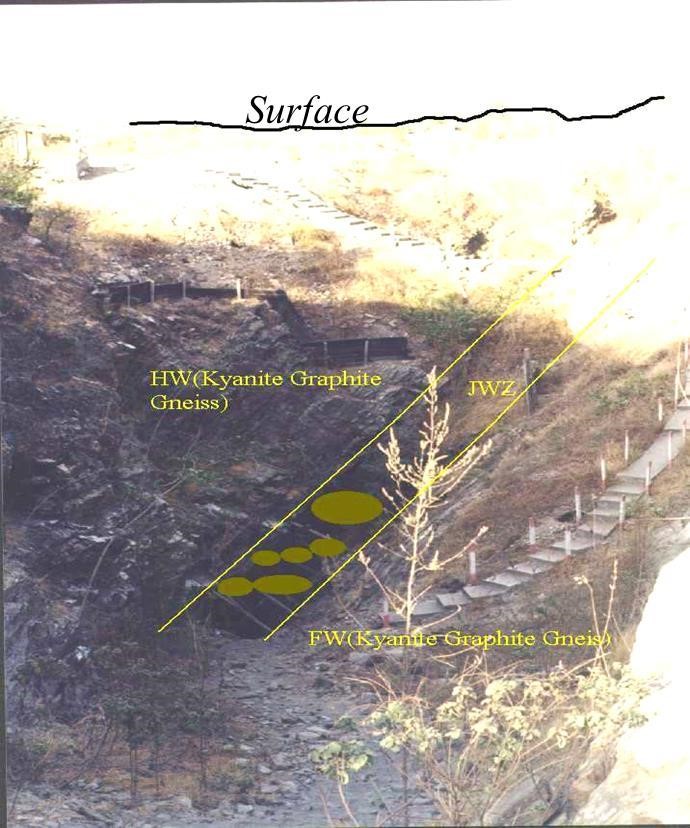
The ore zone is not only highly folded but also intensely boudinaged (Fig. 6). These boudinaged calc – silicate layers are the main tanzanite producers in the Merelani area. Small amounts of calc silicates are also present in the C – zone. The D – zone in Block D extension also contains significant amounts of calc silicates, duplicated up to seven times by folding, similar to the JW Zone in Block C.
The bulk of the tanzanite mineralization is closely related to pressure shadows within or adjacent to the relicts within boudin structures (Fig. 6). Quartz, calcite, pyrite, gypsum, zoisite (tanzanite) and garnet are the main minerals in these sites.
The structural deformational history of the tanzanite deposit is complex and a combination of structural elements was needed to result in conditions conducive to tanzanite mineralization. For a detailed discussion on the deformational event see document “Formation of Tanzanite .
Repetative and superimposed folding events produced a complex mineralization zone (Fig. 7) (Olivier 2006).
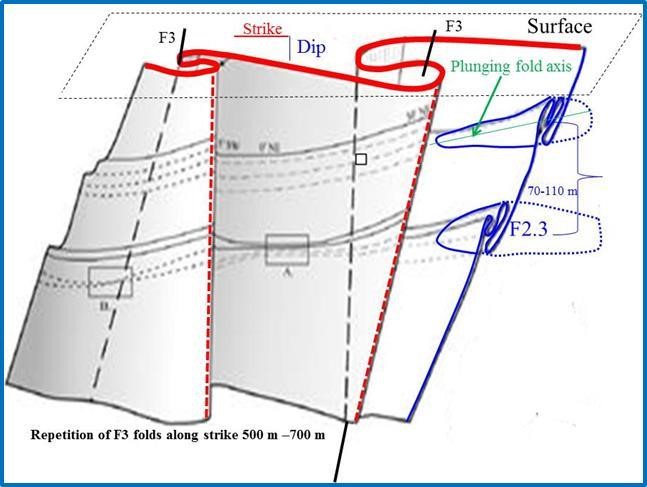
On a mine – scale the isoclinal F2.3 folds delineate the boudinaged tanzanite bearing ore-shoots and plunge on average 10° NE. The fact that the graphite – plagioclase gneisses could act as efficient shear zones (due to abundant graphite) rendered shearing the driving mechanism behind isoclinal duplication as well as effective conduits for fluids on the contacts with the calc-silicates. The F2.3 folds stacks have a separation distance of around 70 to 110 m.
A late stage cross folding event (F3) influences the continuation of the tanzanite mineralization zone and ore shoots in strike direction dramatically (Fig. 7). The F3 folds occur along the strike direction of the Lower Horizon with a separation distance of between 500 m and 700 m. Fortunately for tanzanite mining the ore shoots associated with the F2.3 folds are not displaced as their isoclinal fold axis are not displaced across the F3 fold axis.
The structural deformation, tanzanite location and various metamorphic conditions are part and parcel of the eventual presence and localization of tanzanite. The first phase of deformation (D1) is associated with the prograde metamorphic path towards granulite facies and peak metamorphic conditions (M1) at ca 9 to 12 kbar and 800° to 900° C. A decrease in P-T conditions occurred after M1 and was accompanied by a second phase of deformation (D2), ductile folding (F2) and the M2 metamorphic event under amphibolite facies conditions at 8 to 6 kbar and 700° to 600 ° C.
In addition to the direct structural control on the mining operations of tanzanite many additional factors play a role that control the mining operations of which the ultimate goal is to locate high quality tanzanite at the lowest cost namely:
a) The fact that local conditions such as oxidation/reduction conditions, pH/eH, availability of trace elements (trace element concentrations in fluid), CH4, CO2, H2O concentration, graphite availability and many others undoubtedly control the quality of tanzanite in a specific suitable structural trap
b) Proximity to later brittle shearing.
c) Control of blasting and drilling operation / damaging of tanzanite.
d) Possibility of access to “hidden” boudins taking mine safety conditions into consideration.
MINING.
1.2 The Mining Area
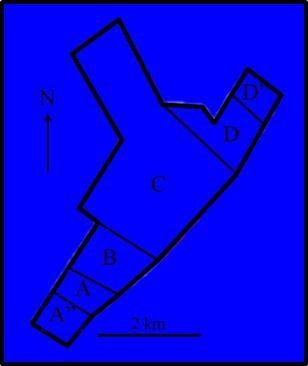
The tanzanite mining area stretches over a distance of approximately 5 km in a N40E direction and comprises 6 main “blocks” or delineated mining licenses namely Block A extension (A”), Block A, Block B, Block C, Block D and Block D extension (D”) (Fig. 8).
Blocks C and D Extension are considered “formal” mining areas for the sake of this document in the sense that mining is centrally controlled and that the shafts on these Block belong to one company.
The other licenses Blocks (A’, A, B and D) are subdivided into 300 m by 300 m entities with individuals controlling single or multiple licenses. In some cases the 300 m by 300 m blocks are subdivided into 50 m by 50 m shaft areas.
Formal mining areas also follow a predetermined mining plan presumably based on scientific input on a day to day basis to control the mining. The informal mining areas seldom follow the rule that the borders of the license areas are, by law, supposed to be vertical underground, even on a 50 m by 50 m scale. Infringements occur on a day to day basis on all levels of mining.
1.3 Surface Mining.
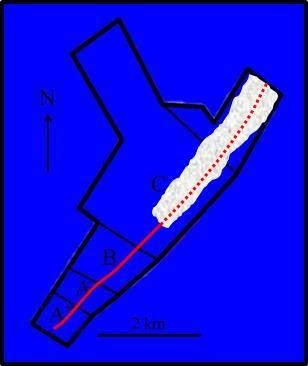
Surface mining in the northern half of the ore deposit is rendered difficult by a calcrete and soil cover of more than 20 m thick in the northern part (Block D”) (Fig. 9). The superficial cover thins towards the southwest and in the central part of Block C, the hard rock ore zone shows outcrops (in the vicinity of the JW – pit – one of the first open cast pits to mine tanzanite) (Fig. 10).
Surface mining has and is being conducted in an alluvial fan draining the tanzanite area towards the NW (Fig. 11). Here pits are dug through thick soil cover to a poorly defined gravel zone containing some alluvial tanzanite.
1.4 Underground Mining.
1.4.1 Informal Mining
As mentioned above, the NE most half of the JW zone, C-zone and D-zone is covered under a thick layer of calcrete, calcareous soil and soil. Informal miners target the JW zone by digging vertical shafts through the calcrete down to hard rock, mainly in Block D (Fig. 12).
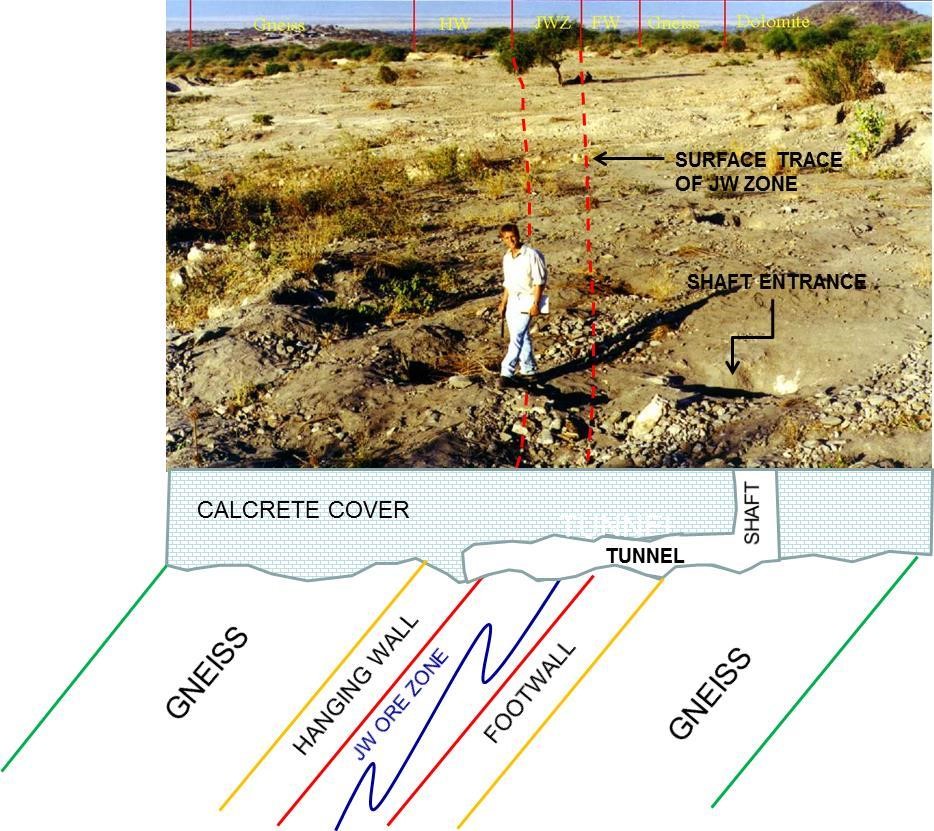
Once down to hard rock, tunnels are directed to intersect the JW zone. If boudins are not intersected at the JW zone by the tunnel, the JW zone is followed in the strike direction on the surface between hard rock and the overlying calcrete and soil. On occasion, weathering of the hard rock surface on the contact led to liberation and transport of tanzanite on the hard rock / calcrete surface. When a boudin horizon is intersected along strike, mining may be directed down plunge of the F2.3 fold axis in the hard rock.
1.4.2 Formal Mining.
Formal mining is conducted by one of a combination of the following for each shaft:
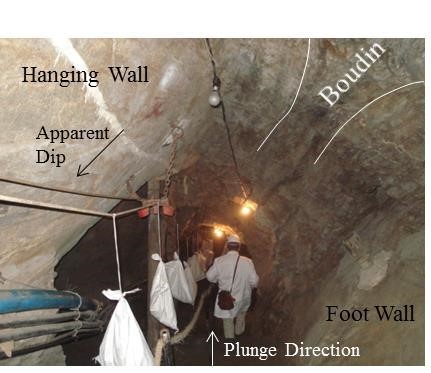
a) Following the JW Zone along plunge of a F2.3 fold axis (Fig. 13). This may be done down or up of the plunge direction. This method provides a high probability of intersecting tanzanite mineralization as the fold axis may be followed along duplication of boudin zones. Examples of shafts mined in this way are the JW Shaft in Block C and Shaft A (Fig. 14) in Block D extension.
In Fig. 15 we are looking down plunge with the apparent dip visible in the Hanging Wall and the Foot Wall. A boudin is opening up dip in the roof of the shaft.
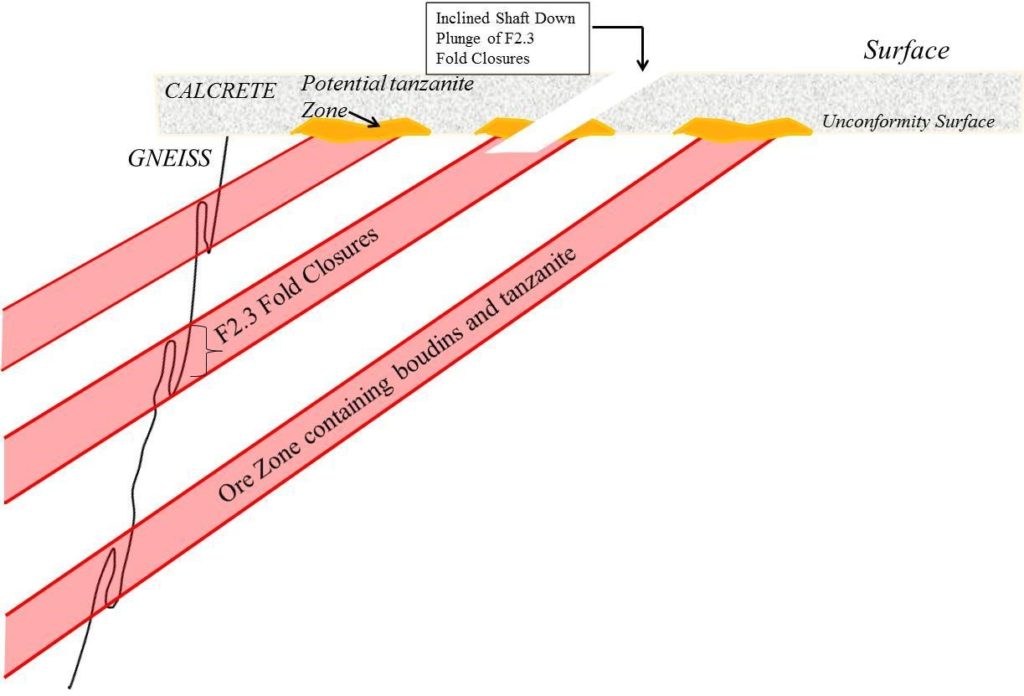
b) Sinking a shaft down dip (or apparent dip) on the JW zone to intersect one or more F2.3 fold axis and then following the F2.3 fold axis down plunge by one or more drives (Fig. 16). Boudin swarms up dip or down dip may be mined by Raizes or Winzes into the ore zone.
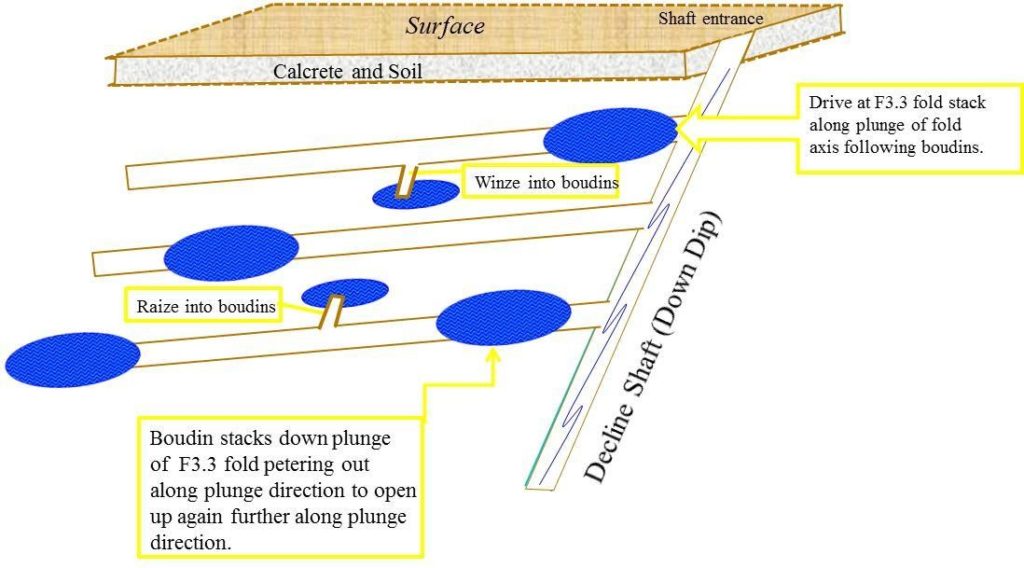
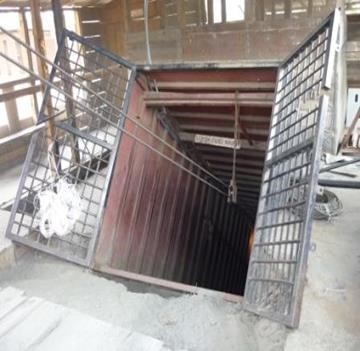
An example of a down dip Shaft entrance in Block D”, Shaft B is shown in Fig.17. The top part of the shaft at entrance is encased in metal to prevent roof and sides from falling in as the top part of the shaft is in calcareous soil. Note the mono-rope system to extract ore.
Some of the mines (Block C) use a skip and winder system to increase the effectiveness of ore extraction. In this scenario mono ropes are used to transport bags of ore from the mining faces through raizes, winzes and drives towards a central skip operated central shaft.
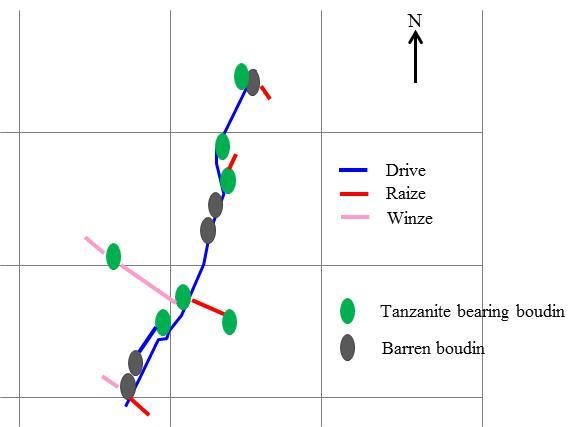
In Fig. 18 an example of a drive (blue) along plunge of an F2.3 fold axis intersecting tanzanite–bearing and barren boudins is illustrated for a shaft in Block D”. Winzes (pink) and raizes (red) are also illustrated. It is clear from this example that not all boudins are tanzanite bearing.
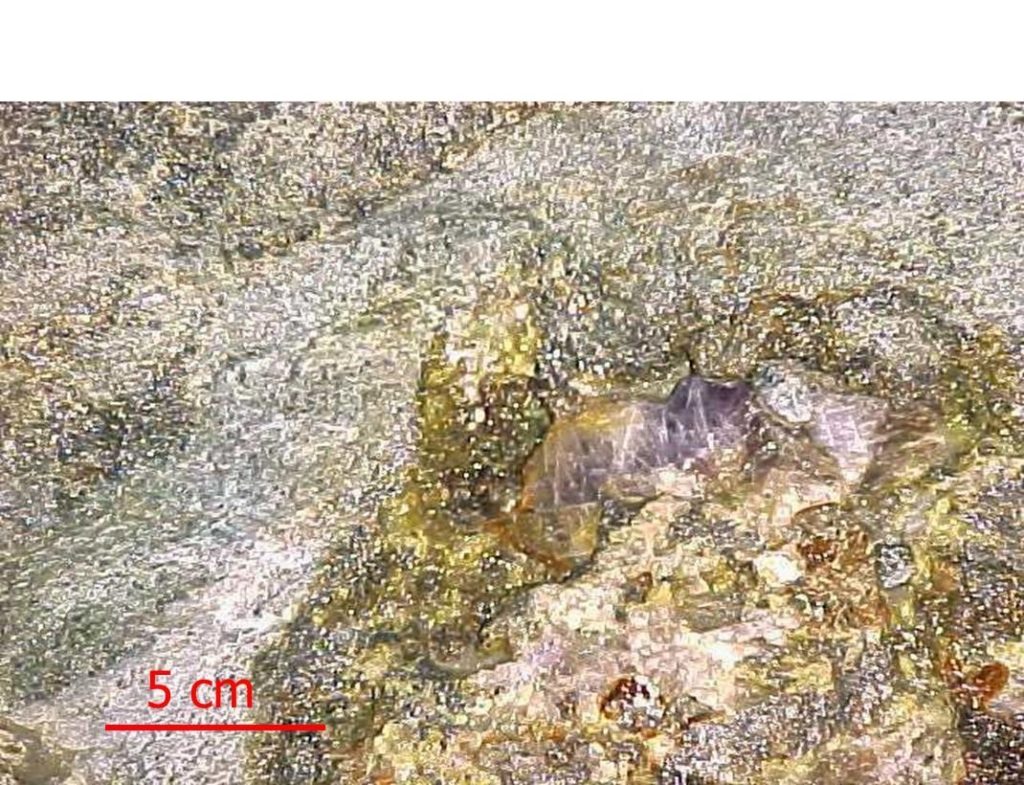
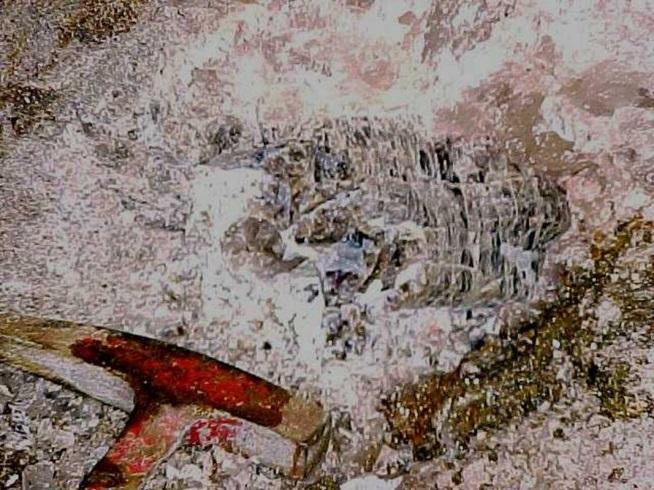
An example of two tanzanite crystals one approximately 5 cm along the c-axis (Fig. 19 Left) and the other approximately 15 cm along the c-axis (Fig. 19 Right) in mineralized boudins are shown.
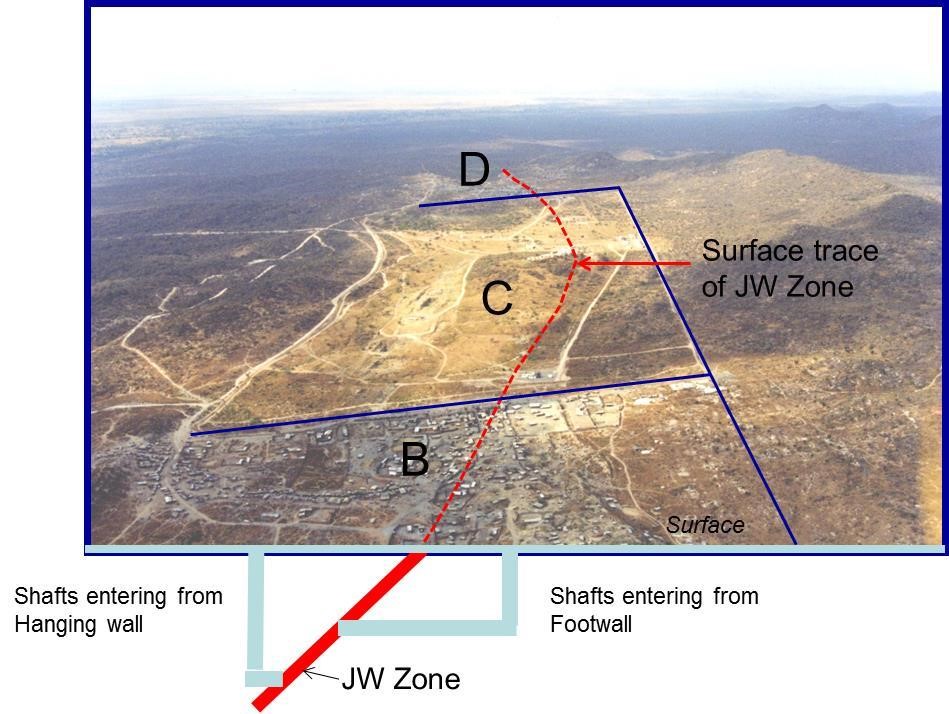
c) Entering the JW Zone by a vertical shaft and horizontal drive from the Hanging Wall and/or Footwall. Once intersected one of methods a) and / or c) may be followed. This is common practice in some shafts in Block B as well as D (Fig. 20).
Selected References.
Cilek V. (1980) The geology of the Merelani tanzanite deposit. Sbornik Geologicktch Ved, Loziskova Geologie Mineralogie, Vol. 21, pp.183.
Coolen J.J.M.M.M., Priem H.N.A., Verdurmen E.A.Th., Verschure R.H. (1982) Possible zircon U-Pb evidence for Pan-African granulite-facies metamorphism in the Mozambique Belt of southern Tanzania. Precambrian Research, Vol. 17, pp.31-40.
Davies C., Chase R.J. (1994) The Merelani graphite-tanzanite deposit, Tanzania: An exploration case history. Exploration, Mining geology, Vol.3, No.4, pp.371-382.
Hepworth J.V. (1972) The Mozambique orogenic belt and its foreland in northeast Tanzania: a photogeologically-based study. Journal of the Geological Society, London. Vol. 128, pp.461-500.
Maboko M.A.H (2001) Isotopic and geochemical constraints on Neoproterozoic crust formation in the Wami River area, Eastern Tanzania. Journal of African Earth Science, Vol. 33, pp.91 – 101.
Malisa E. (1987). Geology of the tanzanite gemstone deposits in the Lelatema Area, NE Tanzania. Annales Acvademae Scientiarum Fennicae, Series A, No. 146.
Malisa E., Muhongo S. (1990) Tectonic setting of gemstone mineralization in the Proterozoic metamorphic terrane of the Mozambique Belt in Tanzania. Precambrian Research, Vol.46, pp.167-176.
Martineau M.P., Davies C. (1996) Merelani tanzanite – a unique occurrence. Minerals Industry International, March, pp.15-22.
Muhongo S., Lenoir J.C. (1994) Pan-African granulite facies metamorphism in the Mozambique belt of Tanzania: U-Pb zircon geochronology. Journal of the Geological Society of London. Vol.151, pp.343-347.
Olivier B., (2006). The Geology and Petrology of the Merelani tanzanite deposit. NE Tanzania. Ph.D. University of Stellenbosch, South Africa. 453 pp.
Pinna P. (1995) On the dual nature of the Mozambique Belt, Mozambique to Kenya. Journal of African Earth Science, Vol. 21, No.3, pp.477-480.
Shackleton, R. M. (1993). Tectonics of the Mozambique Belt in East Africa. Magmatic processes and plate tectonics. H. M. Prichard, T. Alabaster, N. B. W. Harris and Neary. London, United Kingdom, Geological Society of London. Vol.76, pp.345-362
Shackleton, R.M. (1986) Precambrian collision tectonics in Africa. In: Coward, M.R., Ries, A.C. (eds.), Collision tectonics. Geological Society London, Special Publications, Vol. 19. pp.324-349.
Stern, R.J. (1994) Arc assembly and continental collision in the Neoproterozoic East African Orogen: Implications for the assembly of Gondwanaland. Annual Review in Earth and Planetary Science, Vol. 22, pp.319-351.